Comparison of databases
Comparing the data collected during the national forest inventory (NFI) with those of the National Forestry Database (NFD) is limited partially by the following factors:
- the use of different definitions, in particular
- the deviation of reference areas due to the definition of the term forest;
- differences in the methods used for surveying and sampling;
- dissimilarities between the objectives of the two surveys (NFI: fundamentally statistical NFD: regulatory).
Nevertheless, it is by all means useful and meaningful to compare or to juxtapose and study a few of the "fundamental parameters".
The data used from the NFD for the sake of comparison pertain to 01.01.2012, or the middle of the NFIcycle.(Compared date from the NFD refer to 2012.01.01, the middle of the NFI cycle)The NFIdata cover a full data set of areas classified as forest land areas for the purposes of the forest inventory (NFIcomplete) and a subset of the latter, where the specific sampling point is located in planned forest sub-compartment (NFIsub-compartment).( The NFI data include the total area classified as forest land by the inventory and a certain subset that contains the data of those sample points that are located in areas with a management plan)
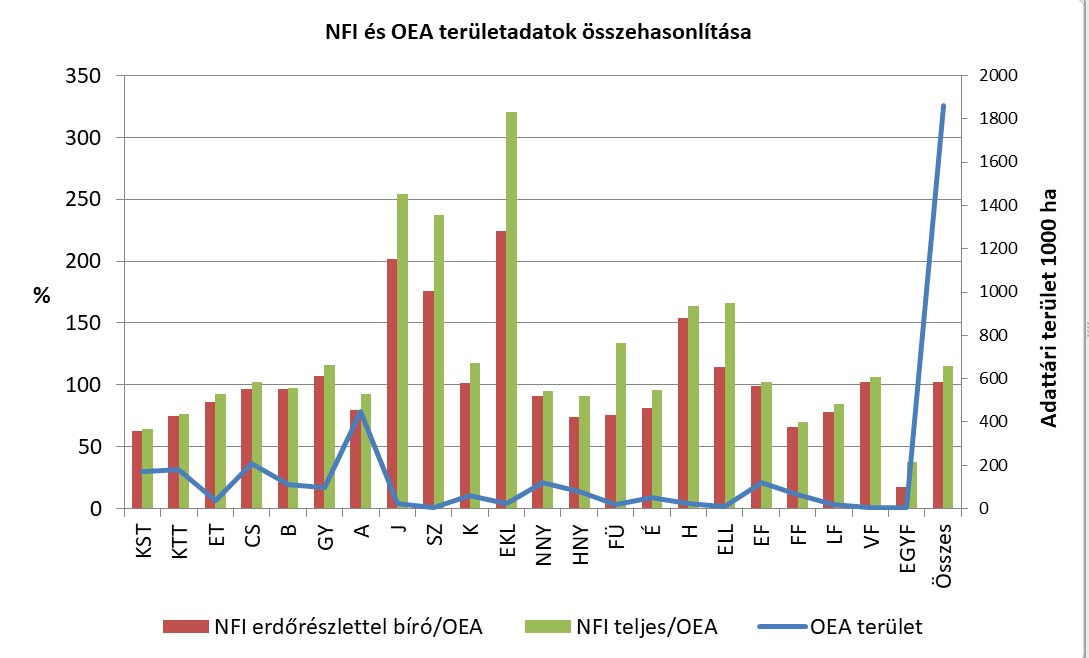
The diagram below compares stocked areas recorded in the NFI and NFD datasets and shows their percentage ratios with NFD data representing 100%. (The following diagram compares stocked area from the forest land area database of the NFI and the NFD, it shows the percentage ratios, with NFD representing/being 100%. )
The figure shows that the values above 100% on left hand side percentage scale are points where the NFI percentages are higher. That, in general, is a valid observation as regards tree species (groups of tree varieties) associated with smaller areas in the NFD, as follows naturally from the expected minimum mixture ratio of 5%, which is a standard used in forest planning and description. The areas "created" this way have to be "gained", they need a source, which explains why some values are below 100%.( As shown in the figure, values on the left hand side scale exceeding 100 % indicate the higher rate of the NFI. This generally applies to tree species (or tree species groups) with smaller territorial representation in the NFD, and it is a direct conclusion drawn from the expectations regarding the mixture ratio applied at a minimum of 5 % during the course of forest management planning. Areas formed this way need to be gained/earned somehow. This is the most common explanation for values below 100 %. )

| NFI és OEA területadatok összehasonlítása | A comparison of NFI and NFD area related data |
|---|---|
| Adattári terület 1000 ha | Database recorded area 1000 ha |
| NFI erdőrészlettel bíró/OEA | NFI with sub-compartments/NFD |
| NFI teljes/OEA | NFI complete/NFD |
| OEA terület | NFD area |
The total area of the NFI with forest sub-compartments is slightly higher than 100% due to the size of the areas represented by a single sampling point.
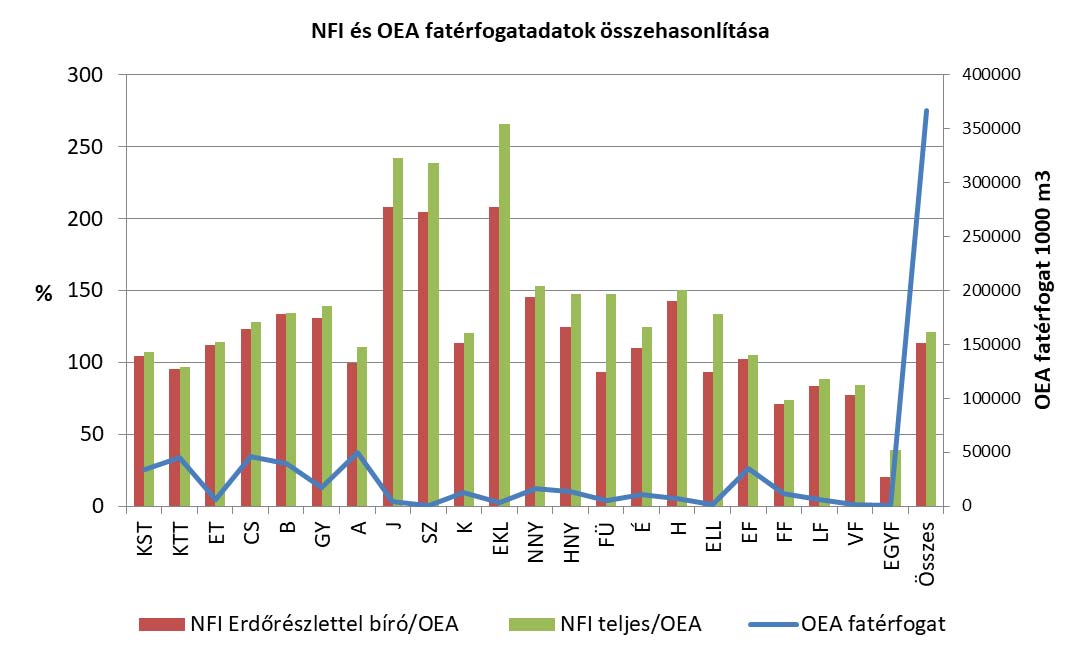
The next slide, which is plotted along the same principles, shows the changes in wood stock, and it shows markedly higher volumes of wood as estimated by the NFI.

| NFI és OEA fatérfogatadatok összehasonlítása | A comparison of NFI and NFD growing stock related data |
|---|---|
| OEA fatérfogat 1000 m3 | Database recorded growing stock 1000 m3 |
| NFI Erdőrészlettel bíró/OEA | NFI with sub-compartments/NFD |
| NFI teljes/OEA | NFI complete/NFD |
| OEA fatérfogat | NFD growing stock |